Authors: Dr. Anil K Tripathi, GM (Env); Gaurav Kumar, DGM (Env); Rajeev Ranjan Prasad, SM (Env)
INTRODUCTION
The use of satellite remote sensing coupled with GIS has been recognized as an effective tool for formulation as well as temporal monitoring of catchments of various watersheds. The Remote Sensing Systems offer four basic components to measure and record data about an area from a distance viz. the energy source (electromagnetic energy), the transmission path, the target and the satellite sensor. As such, multi-spectral satellite remote sensing data with its synoptic and multi-temporal capability provides spatial information on forest cover, geology, hydrogeology, soils and landuse pattern to effectively characterize and monitor catchment properties.
Sedimentation in the reservoir is a function of soil erosion rate of the river catchment area. It reduces the water storage capacity of reservoir and availability of water for its designated use. A useful life of any hydroelectric project is directly related to the soil erosion rates of the catchment area. Therefore, the Catchment Area Treatment (CAT) plan pertains to preparation of a management plan for treatment of erosion prone area of the catchment through biological and engineering measures. Integrated watershed management aimed at minimizing the sedimentation of reservoir and ecosystem conservation are also prime objectives of the catchment area treatment.
The present study was done in-house by Corporate Environment & Diversity Management Division, with the major objective to determine whether the proposed Catchment Area Treatment (CAT) Plan at Rangit Power Station has served its intended function. This Remote Sensing and GIS based study also provided a feed back regarding the effectiveness of recommended/implemented measures under catchment area treatment. The Catchment area treatment work was taken up in phased manner (year wise) starting from 1995-96 and completed in 2002-03. To assess the pre project scenario the November 1994 satellite data of IRS-1B LISS-II was used and further CAT status was evaluated by using IRS 1D LISS-III Imagery of December 2002 and IRS P6 LISS-III Imagery for December 2006. The Imageries were purchased from NRSC, Hyderabad and evaluated using ERDAS Imagine Software.
PROJECT DESCRIPTION
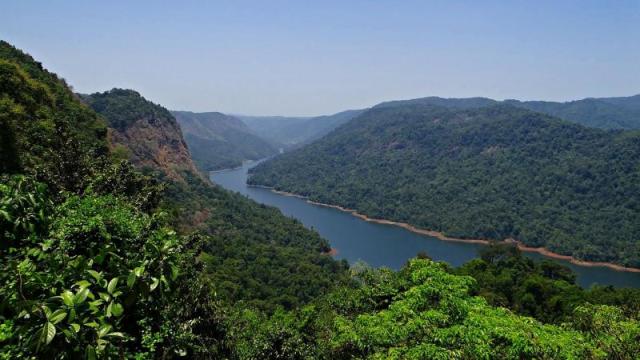
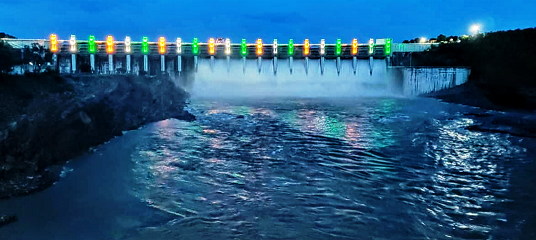
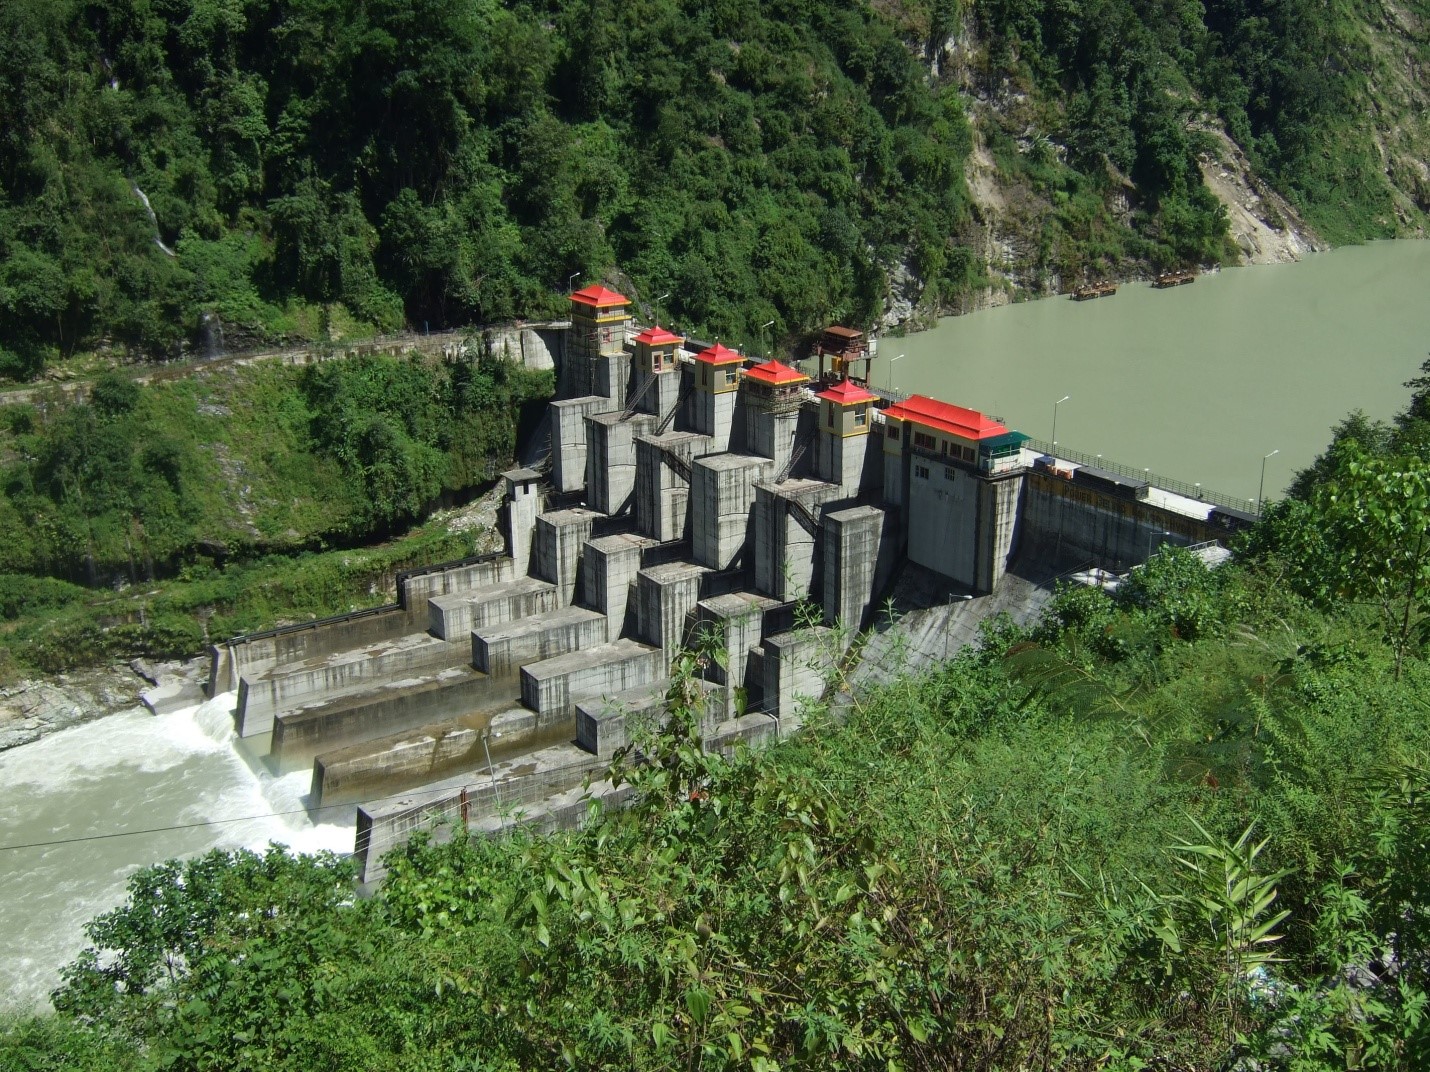
Rangit Power Station is located on river Rangit in Sikkim State in northeastern part of India. It is a run-of-the-river scheme operating under a net head of 129 m, located in the West and South districts of Sikkim. The project constitutes of a 45 m high concrete gravity dam near village Legship, about 350 m downstream to the confluence of river Rathong Chu with river Rangit. Project has a surface powerhouse complex to accommodate 3 units of 20 MW each. The design energy is 339 million units in a 90% dependable year with 95% machine availability. The power station was completed in Dec. 1999 and commercial generation was started from 15 February, 2000.
CATCHMENT CHARACTERISTICS
The catchment area of the Rangit Power Station is located in the south and west district of Sikkim, India. Geographically the catchment area lies in between 27° 16′ 30″ to 27° 37′ 10″ north latitude and 88° 2′ 29” and 88° 25′ 12” east longitude upto dam site near village Legship on the border of West and South districts of Sikkim. The Catchment extends over an area of approximately 979.02 sq km. Its maximum length from north to south is 44.95 km and its maximum width from west to east is 34.9 km. The elevation rises from about 600 m. at the proposed intake point to about 7338 m in the north near the Kabru peak. The Catchment is highly erographic. Assuming snow line at about 4570 m elevation, the Catchment area below the snow line (considered as rain fed) works out to about 712 sq km. This area suffered three major phases of tectonic movements leading to folding and faulting which gave rise to nappe and sub-nappe structures. In the basin Pre-Cambrian rocks are represented by Khangehedzonga gneisses and Chungthang formation. Darjeeling gneisses and early Paleozoics are disposed off in the area due to geological structures. Generally the soils are loamy sand to silty clay loam in texture, dark grayish brown to dark brown in colour, excessively drained to moderately well drained and developed in micaceaus gnessic parent rock and are susceptible to severe erosion hazards due to differences in altitude slope and rainfall.
The Catchment area is drained by the river Rangit and its tributaries Reli Chu, Rothang Chu, Rangit Chu etc. The river flows in north-south direction. The slope below the confluence of Rothang Chu and Rangit, in the dam vicinity, is 1 in 40. The climate is cold and humid and the temperature varies from 1.44°C to 32.78°C. The average annual rainfall is 2620.9 mm in Catchment area with a maximum of 3634 mm and a minimum of 651 mm. The average relative humidity is 83.6% in the morning and 81.2% in the evening thus the climate can be termed as humid which is responsible for a low rate of evapo-transpiration.
CATCHMENT AREA TREATMENT PLAN
The Catchment Area Treatment plan was a mandatory condition imposed by MOEF, Govt. of India while according environmental clearance to the project. Accordingly, CAT plan was prepared delineating the critically eroded areas, with the year wise financial and physical targets of various biological and engineering measures planned to be implemented in the five years duration. The plan was approved by MOEF on 12.12.1994. The CAT plan was prepared for improvement and upgradation of selected sub-watersheds of Rangit Catchment and the execution and implementation part was given to the State Forest Department of Sikkim State Government.
The CAT Plan was prepared with a financial outlay of Rs 11.00 crores (Rs 110 Million). The catchment area of Rangit Power Station consists of 26 sub-watersheds (SWS) covering an area of 979.02 sq km. After integrating soil type, soil depth, slope, landuse/land cover values under all the 26 SWS for generating the Erosion Intensity weightages, five and a half sub-watersheds have been considered for treatment (falling under very severe erosion intensity class) based on priority categorization made by All India Soil and Landuse Survey (AISLUS) i.e., 1) Tb 7a, 2) Tb7b, 3) Tb 6a, 4) Tb6b 5) Tb 5a, and 6) half the area of Tb5c.
IMPLEMENTATION OF CAT PLAN
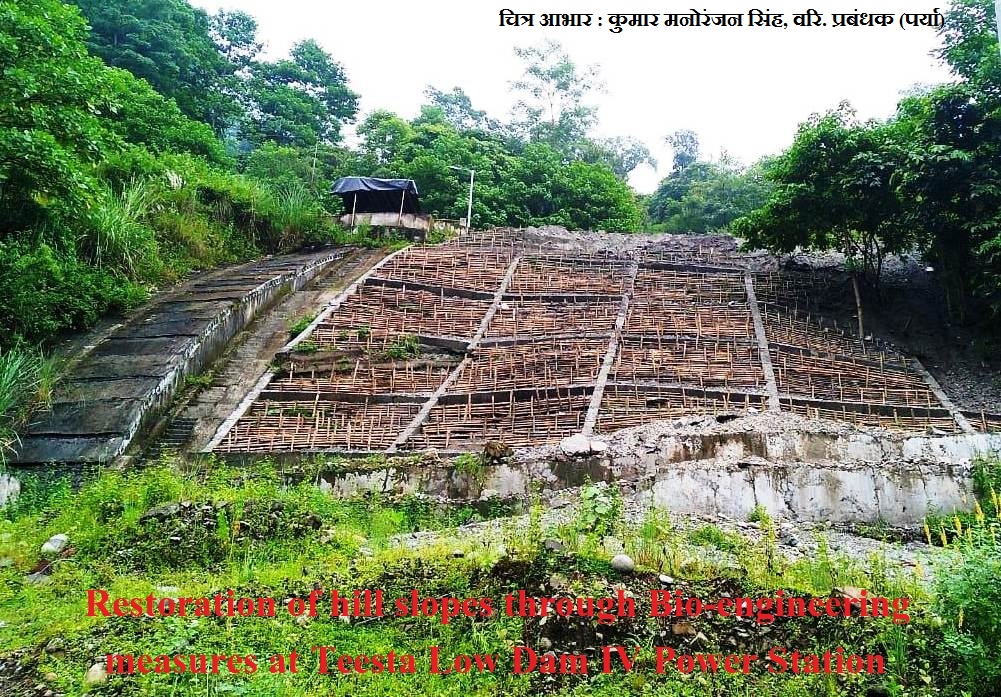
The catchment area treatment work was taken up in phased manner (year wise) starting from 1995-96 and completed in 2002-03. The CAT plan was targeted towards over all improvement in the environment of catchment region. All the activities were aimed at treating the degraded and potential areas of severe soil erosion. The plan provides benefits due to biological and engineering measures, and its utility in maintaining the ecosystem. The plan with objectives addressed issues such as prevention of gully erosion, enhancing the forest cover for increasing soil holding capacity; and arresting total sediment flow in the reservoir and flowing waters.
Initially, the total physical target was 11,106 ha for biological treatment, 584 km for fencing, 2036 no. of protection walls and 4600 meters of catch water drains. During year 2000, a revised supplementary plan amounting to Rs 2,76,77,326/- was approved for the treatment of 1269 ha of balance area for the plantation and maintenance of old plantation/fencing and treatment of slips/slide areas. These areas were treated during 2000-01 and 2001-02 financial years in the revised plan period. In addition, two year for maintenance of old plantation/fencing was undertaken during 2002-2003 and 2003-2004. In total, thirteen sites covering 18 ha area in all the six sub-watersheds were developed as nurseries for raising the seedlings. These nurseries were developed in all the climatic zones of the catchment to ensure the better survival of the plants.
EFFECTIVENESS OF CAT PLAN
The implementation of CAT works started in 1995; as such in order to evaluate the effectiveness of the plan it was proposed to take up remote sensing based studies for the assessment of the works done under CAT. To assess the pre-project scenario, November 1994 satellite data of IRS-1B LISS-II was used and further post CAT status was evaluated by using IRS 1D LISS-III Imagery of December 2002 followed by IRS P6 LISS-III digital data of December 2006.
For the study, Erdas Imagine, Geomedia Professional and Arc View Software were used at different stages of the study. Survey of India (SOI) toposheets (Nos. 78A/2, 78A/6, 78A/3 and 78A/7) in 1:50,000 scale were used for the present study. The soil map prepared by NBSS & LUP, Nagpur for Sikkim in 1: 100,000 scales were subsetted as per the study area, in the study.
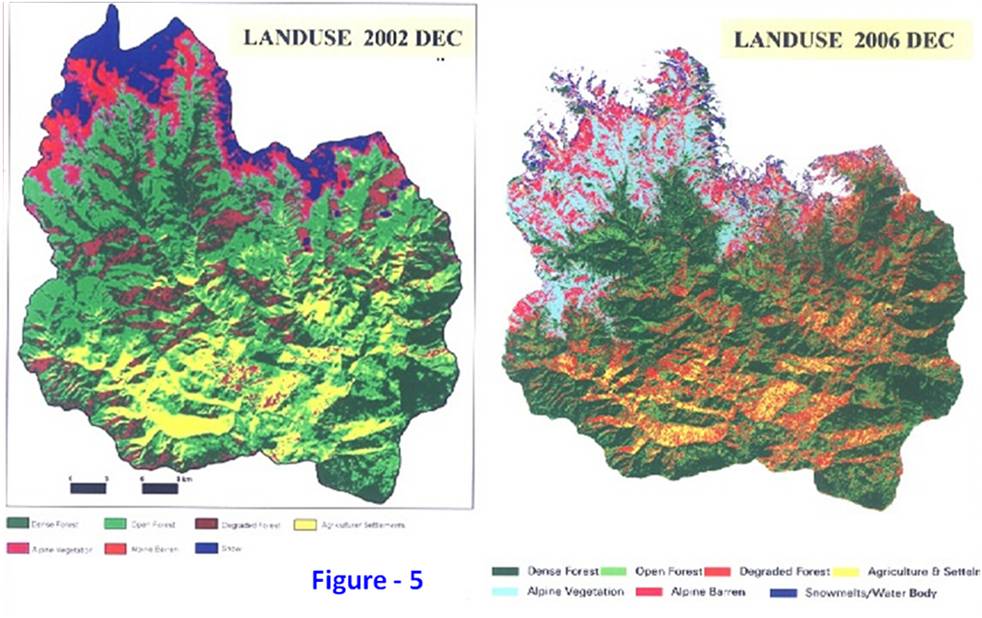
The slope map of the study area was prepared using Digital Elevation Modeling after digitizing the contours of the area at 200 meter intervals. The Landuse maps were prepared by unsupervised classification of the satellite data followed by supervised classification with the help of ERDAS Imagine software. The erosion status was evaluated based upon the integrated information on soil characteristics, physiography, slope and landuse/landcover. The composite map for delineating different erosion intensity units was prepared through superimposition of the above maps i.e. maps showing soil types, slope and landuse/landcover. This thematic mapping of erosion intensity for entire catchment was done using the overlay and union techniques.
The evaluation of three successive digital satellite data reveals that the objectives for which the CAT plan was implemented have been achieved satisfactorily. Based on GIS application, Landuse/Landcover statistics for the Rangit catchment up to dam site have been generated for pre-construction, during construction and post construction stages. The drainage map was extracted from SOI toposheets and the morphometry has been done. The details of landuse status are given in Table-1.
Table-1: Comparison of Landuse Status in Rangit River Catchment
| LANDUSE CATEGORY | Nov-94 | Dec-02 | Dec-06 | ||||
| Area
(in ha) |
% | Area
(in ha) |
% | Area
(in ha) |
% | ||
| Dense Forest | 38138 | 38.96 | 38011 | 38.82 | 33301 | 34.01 | |
| Open Forest | 1344 | 1.37 | 3367 | 3.43 | 16969 | 17.33 | |
| Degraded Forest | 2727 | 2.78 | 15044 | 15.36 | 12240 | 12.50 | |
| Agriculture | 16088 | 16.44 | 23161 | 23.65 | 9461 | 9.66 | |
| Alpine Vegetation | 11772 | 12.02 | 7298 | 7.45 | 9793 | 10.00 | |
| Alpine Barren | 4879 | 4.98 | 3376 | 3.44 | 6723 | 6.87 | |
| Fallow/Waste Land/ | 5075 | 5.19 | — | — | — | – | |
| Waterbody/Glacial Melts | — | — | — | — | 2074 | 2.12 | |
| Snow | 17879 | 18.26 | 7645 | 7.85 | 7342 | 7.50 | |
| Total | 97902 | 100 | 97902 | 100 | 97902 | 100.00 | |
It is evident that the forest cover is rapidly increasing with the time in the catchment. Dense and open forest category together has increased from 39482 ha in 1994 to 41378 ha in 2002 and then 50270 ha in the year 2006. The dense and open forest cover has increased from 40.33% to 51.34% in the area in 12 years. This is an encouraging success story of the CAT plan implementation. The decrease in degraded forest category is also noted by 2.86% in 2006 when comparing with 2002 status. The reduction in agricultural zones have been observed in satellite data of 2006 since the zoom cultivation is showing trend of reduction, which is also a positive sign.
Determination of erosion intensity unit is primarily based upon the integrated information on soil characteristics, physiography, slope and landuse/landcover. The analysis has been done for the sub-watersheds considered for treatment under the CAT plan. The composite map for delineating different erosion intensity units was prepared through superimposition of various maps i.e. maps showing soil types, slope and landuse/landcover. This thematic mapping of erosion intensity for catchment considered for treatment by biological and engineering measures were done using the overlay and union techniques. There has been remarkable decrease in very severe and severe erosion intensity category areas in the subsequent years. This is indicative of stability and reduction in sediment load contribution by streams and nallas into reservoir. Decrease in very severe and sever erosion zones in the sub-watershed after treatment explains that the CAT plan is basic approach towards sustainable development, and has been achieved in case of Rangit Project. The results show the effective implementation of the CAT plan.
Table – 2 : Comparison of erosion intensity classes between 1994, 2002 and 2006
| Category | Area (in Ha) | ||
| November-1994 | December-2002 | December 2006 | |
| Very Severe | 224 | 148 | 144 |
| Severe | 2754 | 2433 | 485 |
| Moderate | 4963 | 4483 | 3464 |
| Slight | 4121 | 5218 | 3233 |
| Negligible | 713 | 492 | 5320 |
| Snow/Data error | — | — | 95 |
| Total | 12775 | 12775 | 12775 |
On comparison of the landuse pattern in the Rangit catchment, it has been found that the impact of the project on the landuse is found to be minimal and positive results are observed. The analysis is based on the changes in landuse pattern between 1994 and 2006.
The results of the change detection analysis for Rangit catchment are given in Table 3 (a) and 3 (b). The Landuse classes analysed in 1994 was taken as base data for the change detection study and then the weightages values (positive, negative & no change) were assigned to the landuse classes identified in year 2002 and year 2006.
In areas where the degraded forest category has changed into dense or open category “positive” value has been assigned. Similarly, if dense forest is converted to open or degraded category then “negative” value is assigned. In a similar manner if there is no change in the time period of 12 years “no change” value has been assigned.
The overall performance of CAT plan in Rangit Project is found to be satisfactory. The objectives of the CAT plan have been achieved through an integrated approach comprising of both biological and engineering measures.
Table – 3 (a): Change detection analysis for entire Rangit Catchment
| S.No. | Change Detection | Area (in ha) | % |
| 1. | Positive | 62346 | 63.7 |
| 2. | Negative | 10902 | 11.1 |
| 3. | No changes | 24654 | 25.2 |
| Total | 97902 | 100 | |
Table – 3 (b): Change detection analysis of area under treatment in Rangit Catchment
| S.No. | SWS | Area (in Hectares) | |||||||
| Positive | % | Negative | % | No changes | % | Total | % | ||
| 1 | Tb5a | 1261 | 71.2 | 208 | 11.6 | 303 | 17.1 | 1771 | 100 |
| 2 | Tb5c | 1270 | 76.5 | 131 | 7.9 | 260 | 15.7 | 1661 | 100 |
| 3 | Tb6a | 1253 | 71.2 | 169 | 9.6 | 337 | 19.2 | 1759 | 100 |
| 4 | Tb6b | 1001 | 60.3 | 161 | 9.7 | 497 | 30.0 | 1659 | 100 |
| 5 | Tb7a | 2623 | 88.0 | 188 | 6.3 | 169 | 5.7 | 2979 | 100 |
| 6 | Tb7b | 2559 | 86.9 | 243 | 8.2 | 143 | 4.9 | 2946 | 100 |
| Total | 9967 | 78.0 | 1098 | 8.6 | 1709 | 13.4 | 12775 | 100 | |
CONCLUSION
The Rangit Power Station, since its inception has always given due emphasis on maintaining the harmonious blend between development and ecological systems. The post construction evaluation of CAT plan reveals that the objective for which the CAT plan was implemented i.e. reclamation of degraded areas in the catchment, have been fully achieved. The catchment area treatment works for Rangit Power Station which have been taken up in phased manner (year wise) starting from 1995-96 and completed by 2002-03 are showing positive results when compared with the satellite data of the year 1994 (before CAT plan implementation) and year 2006 (four years after CAT plan implementation).
The results are encouraging as there has been a decrease in the area under soil erosion category of ‘very severe’, ‘severe’ and ‘moderate’ category, however, the increase in the area under ‘slight category’ is due to increase in forest area. The area under agriculture has decreased substantially, since the areas have been converted to open and degraded forest category due to plantations under CAT plan. Being hilly terrain utmost care should be taken to avoid any faulty agricultural practices. The landslide stabilization has been achieved with the implementation of engineering measures which shows the satisfactory implementation of the engineering measures. Performance evaluation of the CAT plan based on certain indices show that the results are very encouraging. The successful implementation of CAT plan at Rangit project shows the commitment of NHPC in developing hydropower in a sustainable manner.


Leave a Reply